PHỤ KIỆN KÍNH HIỂN VI
|
Sản phẩm |
Ưu điểm |
Ứng dụng chính |
Thông tin khác |
|
|---|---|---|---|---|
|
Light Sources
|
Low cost broad band fluorescence illuminator |
General Fluorescence GFP, FITC, DAPI, fluorescein, Rhodamine, |
|
|
|
Tunable from 250 to 650 nm Switches between any λ pair in 2 ms |
Intracellular ratiometric fluorescence Fura-2 {Ca++], FRET, BCECF [pH} |
|
||
|
Low cost tunable illuminator from 250 to 1,100 nm |
General Fluorescence |
|
|
Sản phẩm |
Ưu điểm |
Ứng dụng chính |
Thông tin khác |
|
|---|---|---|---|---|
|
Imaging Cameras
|
UV EMCCD |
Fluorescence, Live Cell Imaging |
|
|
|
VIS EMCCD |
Fluorescence, Live Cell Imaging |
|
||
|
High Resolution sCMOS |
Fluorescence, Live Cell Imaging |
|

|
Sản phẩm |
Ưu điểm |
Ứng dụng chính |
Thông tin khác |
|
|---|---|---|---|---|
|
PMT Point Detectors
|
Millisecond kinetics Ultimate sensitivity & dynamic range |
Quantitative fluorescence |
|
|
Sản phẩm |
Ưu điểm |
Ứng dụng chính |
Thông tin khác |
|
|---|---|---|---|---|
|
Micro-Spectrometers
|
Low cost luminescence system, multi-wavelength excitation, broad spectral range |
Photoluminescence, Electroluminescence, Raman, Photoreflectance |
|
Nhà sản xuất: HORIBA Scientific
Các phụ kiện kính hiển vi của HORIBA có sẵn dưới dạng các thiết bị độc lập, tuy nhiên, nếu khách hàng đang tìm kiếm một hệ thống hoàn chỉnh với phần mềm điều khiển và các khả năng phân tích, vui lòng xem xét các hệ thống của PTI
- Intracellular Ca++
- FRET Microscopy
- Electrophysiology
- GFP, FITC, Fluorescein, Rhodamine
- Intracellular Ca2+
- Single HEK293 Cell Ca2+ Imaging
- Dopamine-induced Ca2+ Transients in Rat MSN
- Intracellular Ca2+ in Human Neuronal Cell Cultures
- Mitochondria [Ca2+]m in Single Cells
- Measurement of Extracellular Near-membrane [Ca2+]
- Mechanical Stimulation Increases Ca2+ Waves
- Mechanical Wounding Increases Ca2+ Waves
- Intracellular Ca2+ Concentration of ROG Cells in Response to FSH and ATP
- [Ca2+]i Response to ATP
- Regenerative Ca2+ Oscillations
- Simultaneous Measurement of Phagocytosis and [Ca2+]i
- Correlation of Oxidative Activation with Ca2+ and Phagocytosis
- Local Oxidase Activation and Ca2+ Signal Reported by Fura2-dextran Conjugate
- Store-Operated Sr2+ Entry
- Use of DCDHF as an Oxidative Indicator During Phagocytosis
- Ca2+ Imaging of Rat Medium Spiny Neurons
- Dose-dependence of Trehalose Response in S2-Gr5a Cells
- Time Course of Trehalose Response in S2-Gr5a Cells
- Cells Expression Redo-GFP
- Visualization of Mitochondria by mitoGFP
- IP3-induced Intracellular [Ca2+]c and Mitochondrial [Ca2+]m Responses
- Simultaneous Measurement of Ca2+ and Myocyte Cell Length
- Simultaneous Ca++ Fluorescence and Patch Clamp Electrophysiology Research

- Brian Research, 921(1-2): 1-11, 2001.
Courtesy of Dr. G. Brewer
- Fura-2/AM loaded neurons
- Illuminator: PTI DeltaRAM
- Camera: Sensys CCD
- Software: PTI ImageMaster™
- Imaging: Typical Fura-2-fluorescence ratio imaging for intracellular Ca2+ in hippocampal neurons from old rats before NMDA (A) and after NMDA (B), scale values in nM

- PNAS 101 (35), 13062-13067. 2004
Courtesy of Dr. S. Chen
- HEK293 cell loaded with Fura-2.
- Illuminator: PTI DeltaRAM
- Software: PTI ImageMaster™
- In the picture:(A) Single-cell fluorescent Ca2+ images in the presence (Upper) or absence (Lower) of 0.3 mM caffeine at various [Ca2+]o (0-1.0 mM).
(B) Fura-2 ratios of representative RyR2(wt) cells in the absence (green trace) and presence (blue trace) of 0.3 mM caffeine and a HEK293 parental cell expressing no RyR2 (pink trace)

- J. Biol. Chem.,279 (40), 42082-42094, 2004.
Courtesy of Dr. I. Bezprozvanny
- EGFP transfected rat MSN cultures loaded with Fura2/AM
- Illuminator: PTI DeltaRAM
- Camera: PTI IC-300
- Software: PTI ImageMaster™ Pro
- Fura-2 340/380 nm ratios in rat MSN before (-1 min) and after (0–28 min) application of 400 µM dopamine

- J. of Neuroimmu, 98(2): 185-200, 1999.
Courtesy of Dr. H. Gendelman
- Fura-2AM loaded human neurons
- Illuminator: PTI DeltaRAM
- Camera: Photometrics CCCD
- Software: PTI ImageMaster™
- Imaging: Fura-2 imaging in SDF-1 treated (B) and control (A) neuronal cells. SDF-1 activate intracellular calcium
![Mitochondria [Ca2+]m in Single Cells](http://www.horiba.com/uploads/pics/mitochondria-Ca2-in-single-cells.jpg "Mitochondria [Ca2+]m in Single Cells")
- J. of Neuroimmu, 98(2): 185-200, 1999.
Courtesy of Dr. H. Gendelman
EMBO, 18(1): 96-108,
Courtesy of Dr. Hajnoczky
- Fura2FF-loaded single permeabilized RBL cells
- PTI DeltaRAM illuminator
- Photometrics PXL CCCD camera
![Measurement of Extracellular Near-membrane [Ca2+]](http://www.horiba.com/uploads/pics/extracellular-near-membrane-Ca2.jpg "Measurement of Extracellular Near-membrane [Ca2+]")
- J Cell Sci, 2003, 116(pt 8): 1527-38.
Courtesy of Dr. Hofer, A. M
- Fura-C18-loaded HEK CaR cells
- Illuminator: PTI DeltaRAM
- Camera: PTI IC-100
- Images a–c: ratio images taken at different time points
- Image d shows fluorescence at 340 nm excitation (510 nm emission) of the same cells

- Am J Physiol Lung Cell Mol Physiol 280: L221-L228, 2001.
Courtesy of Dr. S. Boitano
- Fura-2 AM loaded rat alveolar epithelial cells (AECs)
- Illuminator: PTI DeltaRAM Camera: PTI ICCD camera
- Software: PTI ImageMaster™
- Images: A-D: Mechanical stimulation resulted in a Ca2+ wave that averaged slightly over 4 cells
- E–H: in the presence of the gap junction-inhibiting peptide Gap 27, [Ca2+]i increase restricted to the stimulated cell
- I–L: Apyrase did not significantly reduce Ca2+ wave propagation
- Arrow: Cell that was briefly stimulated with a glass micropipette
- White lines, cell borders
- Color bar, approximate [Ca2+]i

- Am J Physiol Lung Cell Mol Physiol 280: L221-L228, 2001.<br/ >Courtesy of Dr. S. Boitano
- Fura-2 AM loaded rat alveolar epithelial cells (AECs)
- Illuminator: PTI DeltaRAM
- Camera: PTI ICCD camera
- Software: PTI ImageMaster™
- Images: A–D: mechanical wound-induced Ca2+ waves
- E–H: gap junction inhibitor does not affect this Ca2+ waves
- I–L: apyrase restricts this Ca2+ waves
- Arrow: Cell that was mechanically wounded
- White lines, cell borders
- Color bar, approximate [Ca2+]i

- Endocrinology Vol. 141, No. 9 3461-3470.
Courtesy of Dr. T. Ji
- Fura-2 AM loaded ROG cells
- Illuminator: PTI DeltaRAM
- Camera: ICCD camera
- Software: PTI ImageMaster™
![[Ca2+]i Response to ATP](http://www.horiba.com/uploads/pics/Ca2-response-to-ATP.jpg "[Ca2+]i Response to ATP")
- Am J Physiol Lung Cell Mol Physiol 280: L221-L228, 2001.
Courtesy of Dr. S. Boitano
- Fura-2/AM loaded ROG cells
- Illuminator: PTI DeltaRAM
- Camera: ICCD camera
- Software: PTI ImageMaster™

- Biophys J, 79 (5): 2509-2525, 2000.
Courtesy of Dr. I, Pessah
- Fura-2/AM loaded differentiated 1B5 myotubes
- Illuminator: PTI DeltaRAM
- Camera: ICCD 300 camera
- Software: PTI ImageMaster™
- Images: (A) Cells stimulated with 3 mM caffeine. After 2 s, a calcium wave begins from a discrete region and spreads across the cell. After ~2 s more, the calcium wave occurs again. (C)The corresponding change in the Fura-2 340/380 ratio (B) Ratio images from the same cell in A stimulated with 40 mM caffeine. Calcium increases globally throughout the cell, and no calcium waves or oscillations are observed. (D) The corresponding change in the Fura-2 340/380 ratio
![Simultaneous Measurement of Phagocytosis and [Ca2+]i](http://www.horiba.com/uploads/pics/simultaneous-measurement-phagocytosis-Ca2.jpg "Simultaneous Measurement of Phagocytosis and [Ca2+]i")
- J Cell Sci 2003;116:2857-2865.
Courtesy of Dr. Dewitt, S. et al.
- Illuminator: PTI DeltaRAM
- Camera: PTI ICCD100
- Fura-2 labeled human neutrophils were presented with a DCDHF-labelled C3bi-opsonised particle for phagocytosis
- Images: Phase contract (top) and corresponding fura2 signal (middle). 90 s: micropipette presenting the particle to the cell; 102 s:adhesion of the particle to the cell without Ca2+signaling; 123 s: formation of the phagocytic cup; 141s: closure of the phagosome 180 s: completion of the event and the return of cytosolic free Ca2+ to baseline

- J Cell Sci 2003;116:2857-2865.
Courtesy of Dr. Dewitt, S. et al.
- Illuminator: PTI DeltaRAM
- Camera: PTI ICCD100
- Images: Top: Phase contract to show the phagocytic event
- Middle row: corresponding fura2 signal to show cytosolic free Ca2+ changes.
- Bottom row: DCDHF fluorescent intensity of the internalized zymosan particle to assess oxidative activity The graph at the bottom shows the complete time course for cytosolic free Ca2+ change (black) and DCDHF intensity (SI) with the point of phagosomal closure marked by the arrow
- Conclusion: the onset of oxidative activity correlates with the second phase of the Ca2+ signal.

- J Cell Sci 2003;116:2857-2865.
Courtesy of Dr. Dewitt, S. et al.
- Illuminator: PTI DeltaRAM
- Camera: PTI ICCD100
- The Fura-2 dextran conjugate micro-injected neutrophils was challenged with an opsonised particle
- Images: Phase contract (top) and corresponding Fura-2 dextran signal (bottom) show the phagocytic cup (270 seconds), phagosome closure (340 seconds) and completion of the Ca2+signal (380 seconds)
- The graph on the right shows the complete Ca2+ data, with the point of phagosome closure marked by the downward arrow.

- J. Biol. Chem., 278 (43):42427-42434,2003.
Courtesy of Dr. J. Deans
- Fura-2/AM loaded CHO cells transfected with CD20 or vector
- System: PTI DeltaRAM based-ImageMaster™ system
- Images: (A) Treatment of the cells
- (B) Images at a, b, and c time points:
- Before store depletion, no difference in base-line fluorescence, and no Sr2+ entry
- ATP depleted Ca2+ stores and sharply increased [Ca2+]c in both cell lines
- Subsequent perfusion of Sr2+ induced a large increase in the CD20-transfected but not the control cells

- J Cell Sci 2003;116:2857-2865.
Courtesy of Dr. Dewitt, S. et al.
- Illuminator: PTI DeltaRAM
- Camera: PTI ICCD100
- Images: (a) DCDHF-conjugated zymosan particles before (left) and after (right) addition of H2O2
- The traces below show the time courses for the increase in fluorescence with the arrow indicating the addition of H2O2
- (b) Fluorescence intensity of internalized (arrowed) and adherent (asterisk) DCDHF-conjugated zymosan particles
- The DCDHF intensity image and the phase contrast image have been superimposed for clarity.

- Neuron, 39 (7): 227-239, 2003.
Courtesy of Dr. Ilya Bezprozvanny
- GFP expression S2 cells loaded with Fura-2
- Illuminator: PTI DeltaRAM
- Camera: PTI IC-300
- Software: PTI ImageMaster™ Pro

- PNAS 100 (suppl. 2):14526-14530, 2003.
Courtesy of Dr. Carlson, J
- GFP expression S2 cells loaded with Fura-2
- Illuminator: PTI DeltaRAM
- Camera: PTI IC-200
- Software: PTI ImageMaster™
- Images: Upper: Divided panels of S2-Gr5a cells (Left and Center) or negative controls, transfected with GFP vector alone (Right), before and after application of either trehalose (Left and Right) or maltose (Center)
- Lower: Images of fields of S2-Gr5a cells taken on application of different concentrations of trehalose.

- PNAS 100 (suppl. 2):14526-14530, 2003.
Courtesy of Dr. Carlson, J
- GFP expression S2 cells loaded with Fura-2
- Illuminator: PTI DeltaRAM
- Camera: PTI IC-200
- Software: PTI ImageMaster™
- Images: Upper: A series of images of a single fura 2-loaded S2-Gr5a cell, taken at 5 s intervals
- Lower: A quantitative representation of the response of the same cell. Bar indicates stimulus period.

- Redo-GFP expressing cells
- PTI DeltaRAM illuminator
- Roper Sensy camera
- PTI ImageMaster™ 3.0 software

- EMBO, 18(1): 96-108,
Courtesy of Dr. Hajnoczky
- mitoGFP transfected intact (A) and permeabilized (B-D) mast cell
- Cells were also loaded with MitoTracker Red (C) or rhod2/AM (D)
- PTI DeltaRAM illuminator.
- Photometrics PXL CCCD camera
- The green images (left panels) show the distribution of mitoGFP, the red images (middle panels) show the distribution of MitoTracker Red (C) or compartmentalized rhod2 (D). These images are overlaid in the right panels to show the coincidence of the labeled organelles (overlay).
![IP3-induced Intracellular [Ca2+]c and Mitochondrial [Ca2+]m Responses](http://www.horiba.com/uploads/pics/IP3-induced-Ca2.jpg "IP3-induced Intracellular [Ca2+]c and Mitochondrial [Ca2+]m Responses")
- EMBO, 18(1): 96-108,
Courtesy of Dr. Hajnoczky
- Fura2FF-loaded permeabilized cell
- PTI DeltaRAM illuminator
- Photometrics PXL CCCD camera
- Left: the overlaid images show the distribution of the membrane-bound CaGreen-C18 (image i, purple) and the mitochondrially compartmentalized Fura2FF (image i, green), and the changes in the Fura2FF fluorescence (images ii-v, 380 nm green/340 nm red) upon addition of 100 nM IP3 (ii versus iii), 12.5 M IP3 (iii versus iv) and ionomycin (iv versus v)
- Right: time courses of the global [Ca2+]pm response (vi) and the average [Ca2+]m response (vii, thick line), and the [Ca2+]m responses of the marked (1–6 on image i) individual mitochondria (vii, thin lines).


- Dual emission channel OBB photometer for Indo-1 Ca++ measurements
The above data traces are from the simultaneous collection of fluorescence and cell length from a cardiac myocyte. Myocyte was loaded with dual emission ratiometric fluorescence probe Indo-1. The OBB/PTI DeltaRAM illuminator was used for excitation illumination at 365 nm and the emitted fluorescence was detected with a dual emission PMT photometer. Above data was collected with FeliX32 photometry software from Photon Technology International (PTI). The blue trace shows the calcium ratio increase and decrease with the cell contraction. The contraction data (Green trace) was detected with a video edge detection electronics module and is correlated with the fluorescence data since both signals were collect simultaneously

- Image courtesy of, Prof. Dr. György Panyi, Department of Biophysics and Cell Biology, University of Debrecen
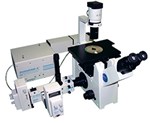
Shown is a picture of a PTI/OBB dual emission photometer attached to the C-mount of an inverted fluorescence microscope. The microscope is also equipped with electrophysiology recording devices and perfusion apparatus. The entire setup is inside a Faraday cage for electrical isolation.
OBB’s photometers are ideal for quantitative live cell measurements of intracellular ion and molecules such as Ca++, Na++, pH, GFP, FRET and FRAP experiments. By allowing for simultaneous quantitative fluorescence detection with patch clamp recordings, these photometers have been widely used by electrophysiologists around the world. The OBB PMT photometer is a passive detection system that provides an output voltage signal proportional to the ion/fluorophore of interest, and this signal is directly fed into the electrophysiology A/D converter and collected with the customer’s existing software. The OBB photometer can collect a fluorescence signal at up to 20 KHz for high speed transient recordings.